How to generate reports that compare portfolios
Clients want to know the values alignment of different portfolios. They want to compare to make data driven decisions.
In this guide, we will show you how to:
- Generate a report that compares two portfolios. This will allow you to build similar reports into your application and wow your clients.
- Use the report API data to construct a sample portfolio comparison report HTML page
The information here will show how the API data is turned into visual components.
Developers are then able take this guide and implement custom visual components with the API data.
Things you will need
- API Access Token
- Two (2) portfolio
ids.- The first portfolio
idyou pass will be the primary portfolio. - The second portfolio
idyou pass will replace YourStake’s default “blended benchmark”, and act as the object for comparison. - Learn how to create portfolios
- Learn how to retrieve a portfolio
- The first portfolio
Get the report data
curl -H "Authorization: Token YourTokenHere" https://www.yourstake.org/api/v1/portfolios/modelportfolio_A3rNbYtpEw2H52eXBpAEeL:modelportfolio_CLWecXizzZJzC3KpzX7JX7/report/impact/
To run the curl command open a terminal and paste the command above.
The JSON response from the API should be similar to.
Note: The response is typically large. I have included a smaller response on purpose. It does not change anything on your end.
{
	"report": {
		"holdings": [
		],
		"metrics": [
			{
				"name": "Tobacco Producer Exposure",
				"value": 11.230493732412395,
				"prefix": "-",
				"unit": "%",
				"mean_weighted_numbers": 0.347,
				"mean_weighted_benchmark_numbers": 0.3909,
				"esgissue_slug": "health",
				"better_than_benchmark": true,
				"impact_factor_id": 87,
				"attribution_id": 9657546,
				"suffix": "%",
				"source_type": "NGO Watchdog",
				"less_is_more": true,
				"description": "Companies involved in the production of tobacco."
			},
			{
				"name": "Weapon Industry Exposure",
				"value": 37.334952193049034,
				"prefix": "-",
				"unit": "%",
				"mean_weighted_numbers": 1.6516,
				"mean_weighted_benchmark_numbers": 2.6356,
				"esgissue_slug": "health",
				"better_than_benchmark": true,
				"impact_factor_id": 95,
				"attribution_id": 9657545,
				"suffix": "%",
				"source_type": "NGO Watchdog",
				"less_is_more": true,
				"description": "Companies involved in the manufacture or sale of weapons."
			},
			{
				"name": "Workplace Health and Safety Violations",
				"value": 14607.0,
				"prefix": "-$",
				"unit": "$",
				"mean_weighted_numbers": 143710.5,
				"mean_weighted_benchmark_numbers": 158317.5,
				"esgissue_slug": "health",
				"better_than_benchmark": true,
				"impact_factor_id": 99,
				"attribution_id": 9287455,
				"suffix": "",
				"source_type": "Government",
				"less_is_more": true,
				"description": "Penalties paid to the US Government for workplace health and safety failures."
			},
		],
		"overall_benchmark_comparison": {
			"health": 61.46127311866647,
			"environment": 65.98189761266397,
			"human-rights": 52.2522104200925,
			"equal-opportunity": 66.47717613934829,
			"accountability": 59.567195877071114
		}
	},
	"firm": {
		"id": 0,
		"name": "Your Firm's name here",
		"logo": "https://yourstakestaging.s3.amazonaws.com/media/advisor/firm/logo/stakelogo.png",
		"compliance_language": "",
		"website": "",
		"parent_firm": null,
		"client_services_email": null,
		"submit_matchmaker_url": ""
	}
}
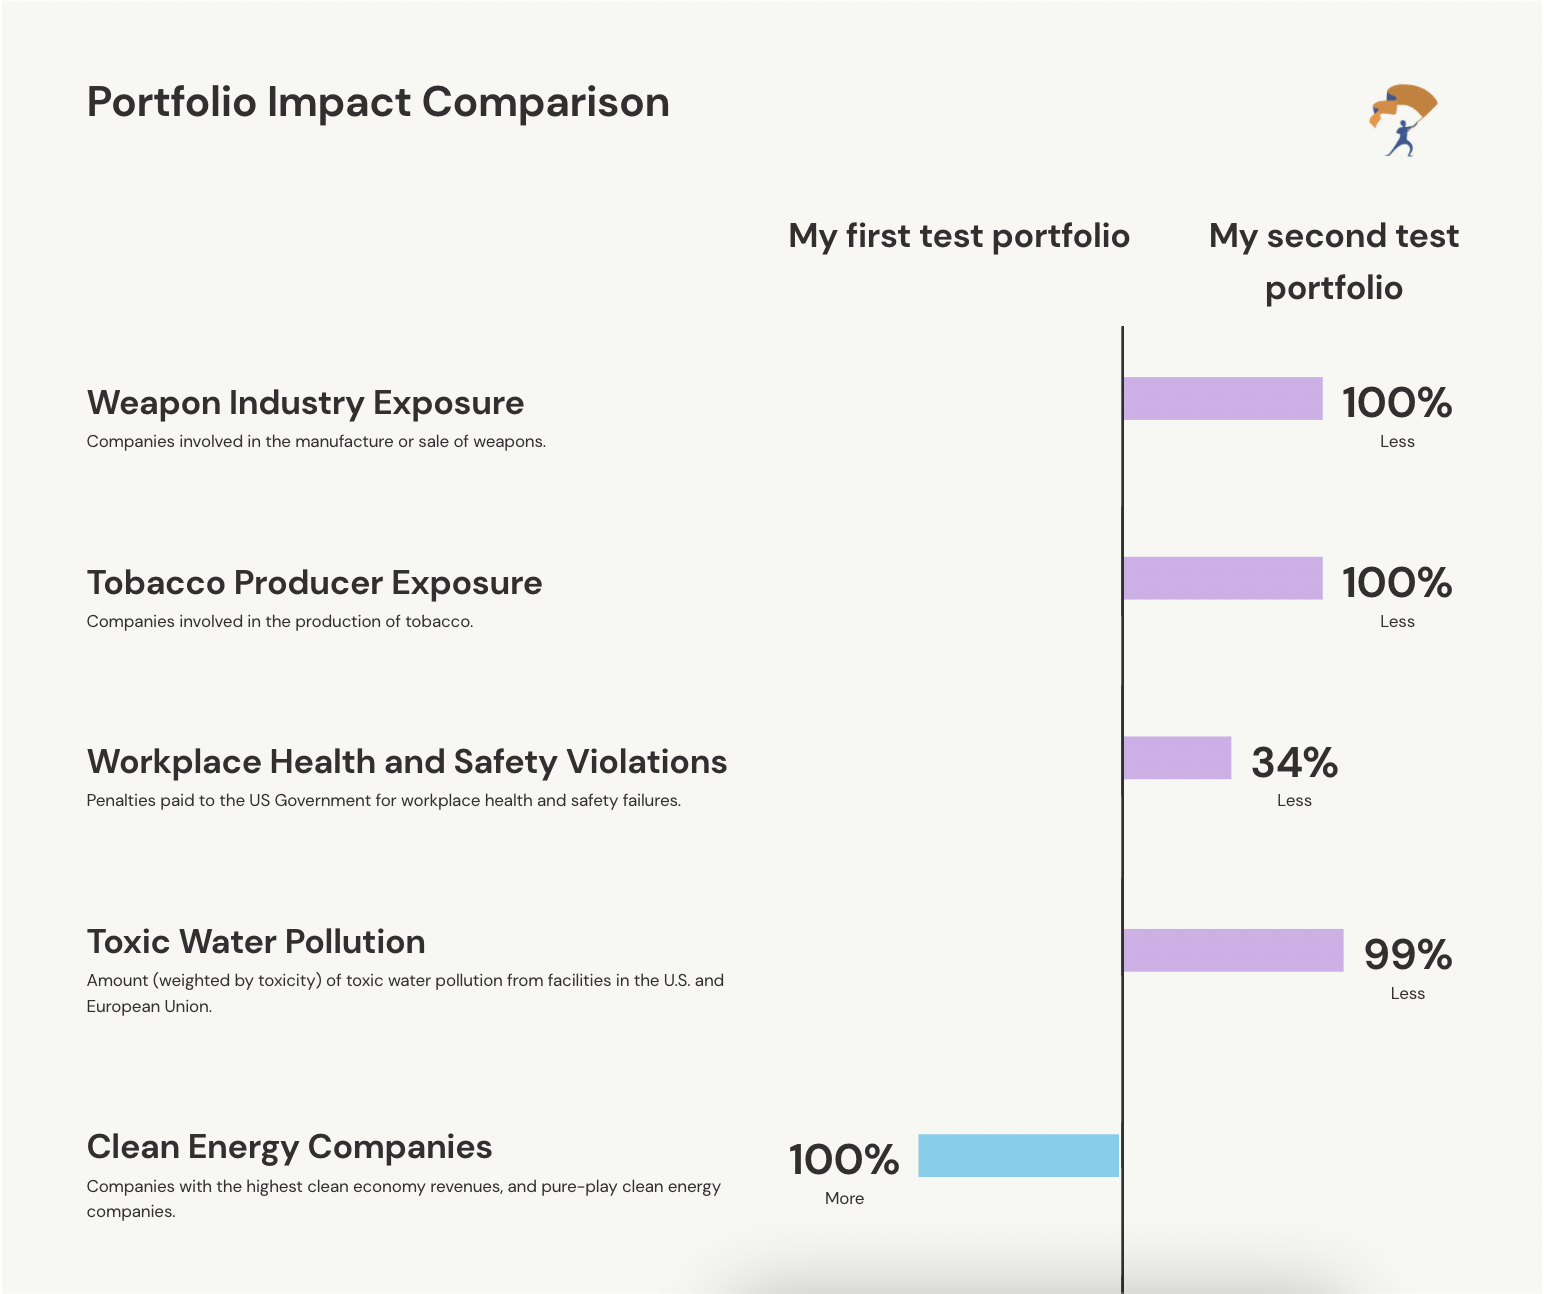
Understanding the report data
The report data you will use to present the portfolio’s ESG impact is located in the metrics array.
{
    "report":
        "metrics": [...]
    ...
}
Each item in the array represents an ESG metric. Metrics have multiple fields. Below is a brief explanation of the fields.
"name": "Tobacco Producer Exposure",
"value": 11.230493732412395,
"prefix": "-",
"unit": "%",
"mean_weighted_numbers": 0.347,
"mean_weighted_benchmark_numbers": 0.3909,
"esgissue_slug": "health",
"better_than_benchmark": true,
"impact_factor_id": 87,
"attribution_id": 9657546,
"suffix": "%",
"source_type": "NGO Watchdog",
"less_is_more": true,
"description": "Companies involved in the production of tobacco."
The name field is the name of the metric.
The value field is the main metric to be displayed. This is the portfolio’s value compared to a benchmark. Note: check the unit response for units.
The prefix field is the symbol used in front of the value field to provide context. For example, the prefix might be “+” or “-“ depending on whether the number is more or less than the benchmark. This can also include words or symbols that give meaningful context.
The unit field defines metric type. E.g. “%”. Can be a word or phrase
The mean_weighted_numbers field is the absolute value of the portfolio on this metric.
The mean_weighted_benchmark_numbers field is the absolute value of the benchmark on this metric.
The esgissue_slug field is the slug of the ESG Issue, see the ESG Issues endpoint for details.
The better_than_benchmark field is a boolean field that lets you know if the metric is better than the benchmark.
The impact_factor_id field provides descriptive information about the metric. See the Impact Factors endpoint for more details
The attribution_id field is the ID to pass to the Report Attribution endpoint to see the breakdown of how each portfolio holding performs for this metric.
The suffix field is the symbol to provide additional context. Suffix is not required.
The source_type field is the type of the source of the information, such as Government, Academia, etc.
The less_is_more field tells you if a lower number is described as “good” from a values-alignment perspective.
The description field describes the metric.
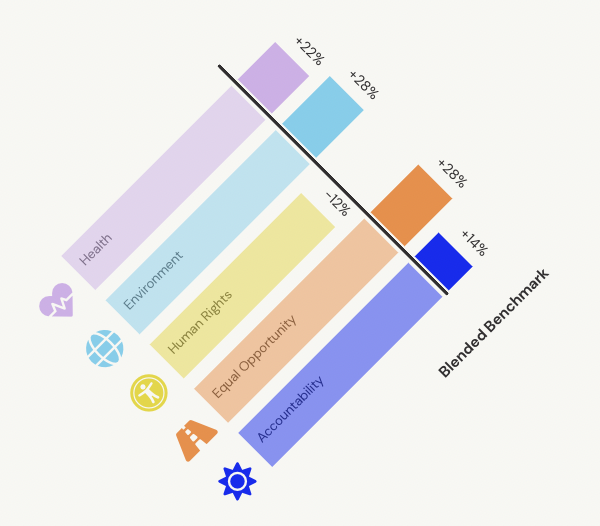
Understanding the overall comparison data
The report field overall_benchmark_comparison contains the values you need to compare the two portfolios on an aggregated basis. The values are the result of calculating the how the first portfolio compares against the second (first vs. benchmark). Each value relates to a specific ESG metric, which are: health, environment, human rights, equal opportunity, and accountability.
"overall_benchmark_comparison": {
    "health": 61.46127311866647,
    "environment": 65.98189761266397,
    "human-rights": 52.2522104200925,
    "equal-opportunity": 66.47717613934829,
    "accountability": 59.567195877071114
}
The API Docs explain how these values are explained.
The overall_benchmark_comparison is a dictionary of esgissue_slug:number, numbers from 0-100 indicating the relationship between the portfolio’s performance on this issue to the benchmark.
A value of 50 represents this portfolio is equal to the benchmark.
The percentage better or worse than the benchmark is equal to twice the difference between 50 and the value. So 75 means 50% better, 100 means 100% better, 25 means 50% worse etc.
Anything over 50% is better than benchmark or portfolio being compared.
To translate the overall_benchmark_comparison return value to the % difference between the portfolios displayed in the YourStake reports, use the formula ((metric - 50) * 2))
In the case of the data above, all of ESG metrics in the first portoflio are better than the second portfolio (the benchmark).
Rendering an HTML comparison report
Download Sample Comparison Report
We have created an HTML template using the report and portfolio data and generated a sample report for you.
This allows you to see a working example and get a hands on understanding of how to incorporate the reports data in your app.
The samples are built using the Bootstrap framework for ease of use.